Reading the Observation Pane
The right-hand pane is not a progress spinner. It is the study itself — every card is rendered from an artifact on disk, so what you see is exactly what the run will use. This page walks the cards top to bottom.
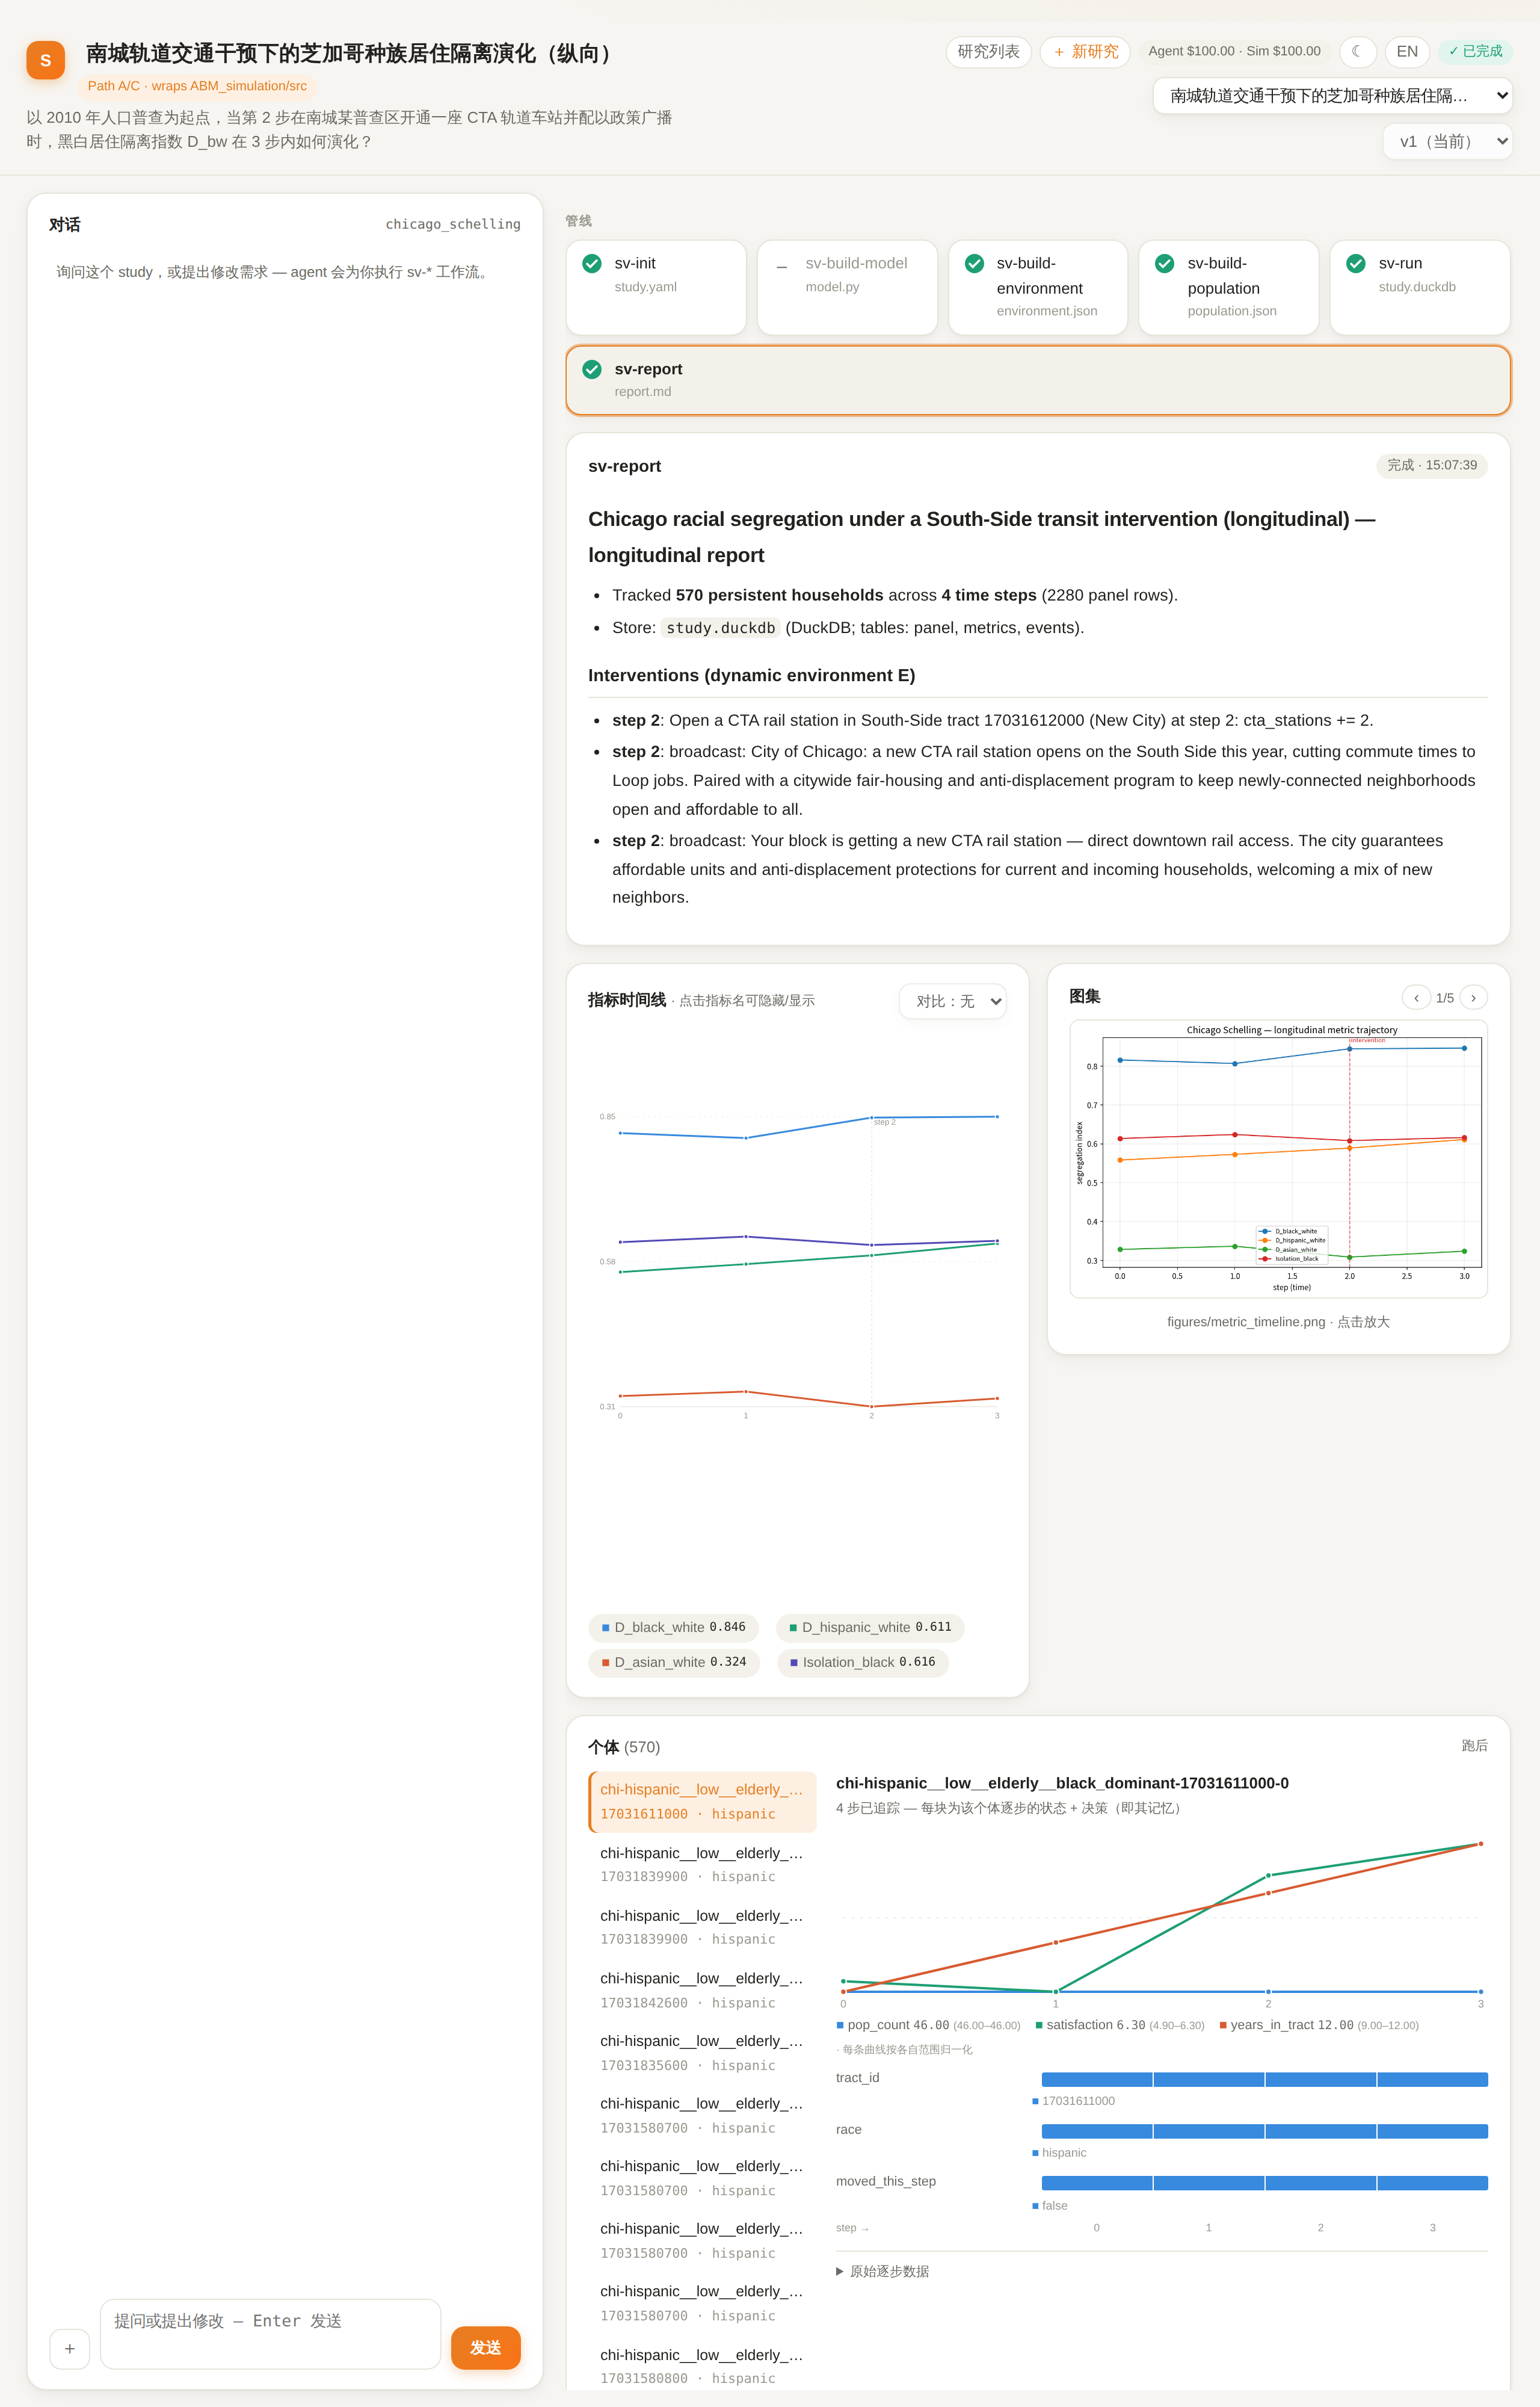
The pipeline rail
One chip per stage: sv-init, sv-build-model (from-scratch studies only),
sv-build-environment, sv-build-population, sv-run, sv-report. Click a
chip to open that stage's detail card.
The chip's state is meaningful:
| state | what it tells you |
|---|---|
| done | this stage's artifact is current |
| stale | the artifact predates something upstream it depends on — it needs re-running |
| inherited | a forked study copied this from its source and you haven't re-authored it yet |
| from v\<n> | this version deliberately reuses its parent's artifact — expected, not a warning |
| 待复核 / pending review | a new version carried this stage forward and it hasn't been reviewed yet |
The review state is the one people miss: after an iteration, stages the change didn't touch still have to be checked before the pipeline counts as finished. The assistant does that by validating each one and reporting on it, and the flag clears as it goes.
Stage detail
Whichever chip is selected, its card shows what that stage produced:
- sv-init — the scoped question, the horizon, the metrics with their one-line meanings, and the grounded facts found by the opening search.
- sv-build-environment — the environment layers with their modality/scope/dynamics, the scheduled interventions and which step they fire on, and the information broadcasts with their audiences.
- sv-build-population — the pool size and, importantly, the composition: how the personas distribute across their attributes. This is where you check the population is who you meant before spending anything on a run.
- sv-run — the run configuration, including what one step means in real
time (
time_unit/step_meaning). A trajectory should read as months or weeks, not as anonymous ticks. - sv-report — the rendered report.
Each card also carries a short reasoning note the stage wrote about its own choices. That's the assistant explaining itself at the point where the decision was made.
A run note, when the run doesn't belong here
Some studies wrap a heavy external pipeline — a reinforcement-learning trainer, for instance — that isn't appropriate to run inside the hosted service. Those carry a run note on the run card telling you to clone the repository and run it locally, and how to import the results back. Drug procurement is the worked example.
Metric timeline
Every metric the study declares for display, as a line, with markers where interventions fired.
- Hover a legend entry to see what that metric actually measures — its units and which direction is "more".
- Click a legend entry to hide that series, which is the fastest way to read a metric whose scale is drowned out by the others.
- The chart streams during a run: the curve grows step by step rather than appearing at the end.
- Once a study has more than one version, the card's title row gains a compare (对比 / vs) selector. Choosing a baseline overlays it as dashed lines in the same colour, draws each version's intervention markers separately, and shows what changed between the two configurations — horizon, seed, added or removed interventions, population size. It affects only this card.
Figures
The report's images, as a carousel — per-step maps for spatial studies, distributions otherwise, plus the metric timeline rendering that goes into the report file.
Agents
The panel data, made inspectable. A list of every agent in the pool; select one and you get its trajectory:
- its state at each step, in the study's own dimensions;
- its decision at each step;
- its output, where the behaviour produces something (a post, a survey answer, a chosen destination);
- and for LLM-driven studies, that agent's reason — one sentence, in the simulated person's own voice, explaining the choice as they would explain it to a peer.
That last one is the difference between a number changing and a number changing for a reason you can read. It is also live: the panel fills in during the run, not only after it.
This is the longitudinal payoff
Aggregate curves tell you the system moved. The agent panel tells you who moved, when, and why — the same individuals, followed across every step. That's what makes the output panel data rather than a sequence of snapshots.
Events
A log of what happened to the study: which stage produced what and when, when interventions fired, when a new version was created. It reconstructs the full history every time, so an earlier line never disappears because a later iteration re-ran the same stage.
Versions
Once a study has been iterated, the version box lists each version with its
note. Selecting an older one renders it read-only from its snapshot, marked
archived — the artifacts, the results, and the figures exactly as that version
had them. Creating a new version jumps the view to it, unless you are
deliberately inspecting an older one.
Grounding
Where the study's numbers came from: facts with their sources, modeling
references, and declared assumptions, each labelled sourced, proxy, or
assumed. The same ledger is rendered as the final section of the report.
Read Grounding & Provenance for what the three bases mean and why the distinction is load-bearing.