Consumer Confidence — when the longitudinal axis is information, not time
studies/consumer_confidence/ · reference: true · Path C (wrapped
ConsumerSim pipeline)
Given a fixed population pool and the news available at a point in time, can
you forecast that month's US consumer confidence — and how does the forecast
update as information accrues within the same month? That second clause is
what makes this case a pattern worth copying: the panel axis is not calendar
time but the as_of information cutoff. Every step re-forecasts the same
target month from a strictly larger, point-in-time-safe information set. It is
the general trick for building an honest longitudinal story out of a simulator
that is natively single-shot.
P / E / B
| what it is | where it comes from | |
|---|---|---|
| P | 12 synthetic stratified personas, us-demo-0001 … us-demo-0012, each a distinct cell of region × age group × income group × education group × location group. interaction: none, propagation independent — respondents do not talk to each other, which is right for a survey instrument. |
population/population.json (materialized_count: 12) |
| E | Two layers only, and no scheduled events, no broadcasts — see below. Provider consumersim.env with region: US, three target_months (all 2026-06) and three as_of_dates. |
environment/environment.json |
| B | Decision consumersim.decision: sampled core agents emit an Action of kind survey_response answering five UMich-style questions positive / neutral / negative. Non-core agents emit not_sampled, which the Bayesian expansion later rewrites to expanded_response. |
adapter/decision.py, adapter/providers.py |
| layer | modality | scope | dynamics | content |
|---|---|---|---|---|
consumer_information |
information | macro | scheduled | point-in-time news + indicator snapshot, refreshed each step as as_of advances |
consumer_demographics |
physical | local | static | the fixed pool's demographics as ConsumerSim consumes them |
An environment with no events is still a dynamic environment
scheduled_events and broadcasts are both empty. E still changes every
step — because the information layer is rebuilt against a new as_of
cutoff. Dynamism does not require an intervention.
The core/expansion split is the other half of the design. core_ratio: 0.5
means 6 of the 12 agents are predicted directly by the LLM each step; the
other 6 are filled in by a hierarchical Bayesian small-area expansion from the
core's group-level posterior. Over three steps that is 18 simulation-layer
LLM calls for full coverage of the pool.
One step, and the horizon
One step is one as_of cutoff inside the same target month: the same 12
agents are re-surveyed against everything published on or before that date.
n_steps: 3, seed: 42, interaction_rounds: 1.
| step | as_of |
target month |
|---|---|---|
| 1 | 2026-06-13 | 2026-06 |
| 2 | 2026-06-20 | 2026-06 |
| 3 | 2026-07-01 | 2026-06 |
Step 0 is a null warm-up row (no as_of, no score) — the pool exists but
nothing has been forecast yet.
Results
| step | as_of |
raw_score |
corrected_score |
news_count |
|---|---|---|---|---|
| 0 | — | — | — | 0 |
| 1 | 2026-06-13 | 128.33 | 129.83 | 4 |
| 2 | 2026-06-20 | 138.33 | 139.83 | 5 |
| 3 | 2026-07-01 | 121.67 | 123.17 | 10 |
population_size stays 12 and core_size stays 6 throughout — the panel is
genuinely fixed, only the information changes.
The forecast traces an inverted V that tracks the information environment
rather than drifting with time: combined_score runs 0.0563 → 0.0900 → 0.0675
and the corrected score follows the same shape. Note that news volume rises
monotonically (4 → 5 → 10) while net sentiment peaks at the middle cutoff and
is then diluted by later, more mixed headlines. More news is not better
news — which is exactly the reading a point-in-time-safe information set is
designed to make visible.
Two honest caveats the report states itself
indicator_countis 0 at every step: the bundled indicator observations are dated after theas_ofcutoffs and were correctly filtered out by the point-in-time guard.combined_scoreis therefore carried by news sentiment alone.- The absolute level (~120–140) is not calibrated. The grounded real-world readings for the same month are Conference Board CCI 91.2 and UMich ICS 44.8. Read this template for direction under accruing information and for the component structure, not for the point level.
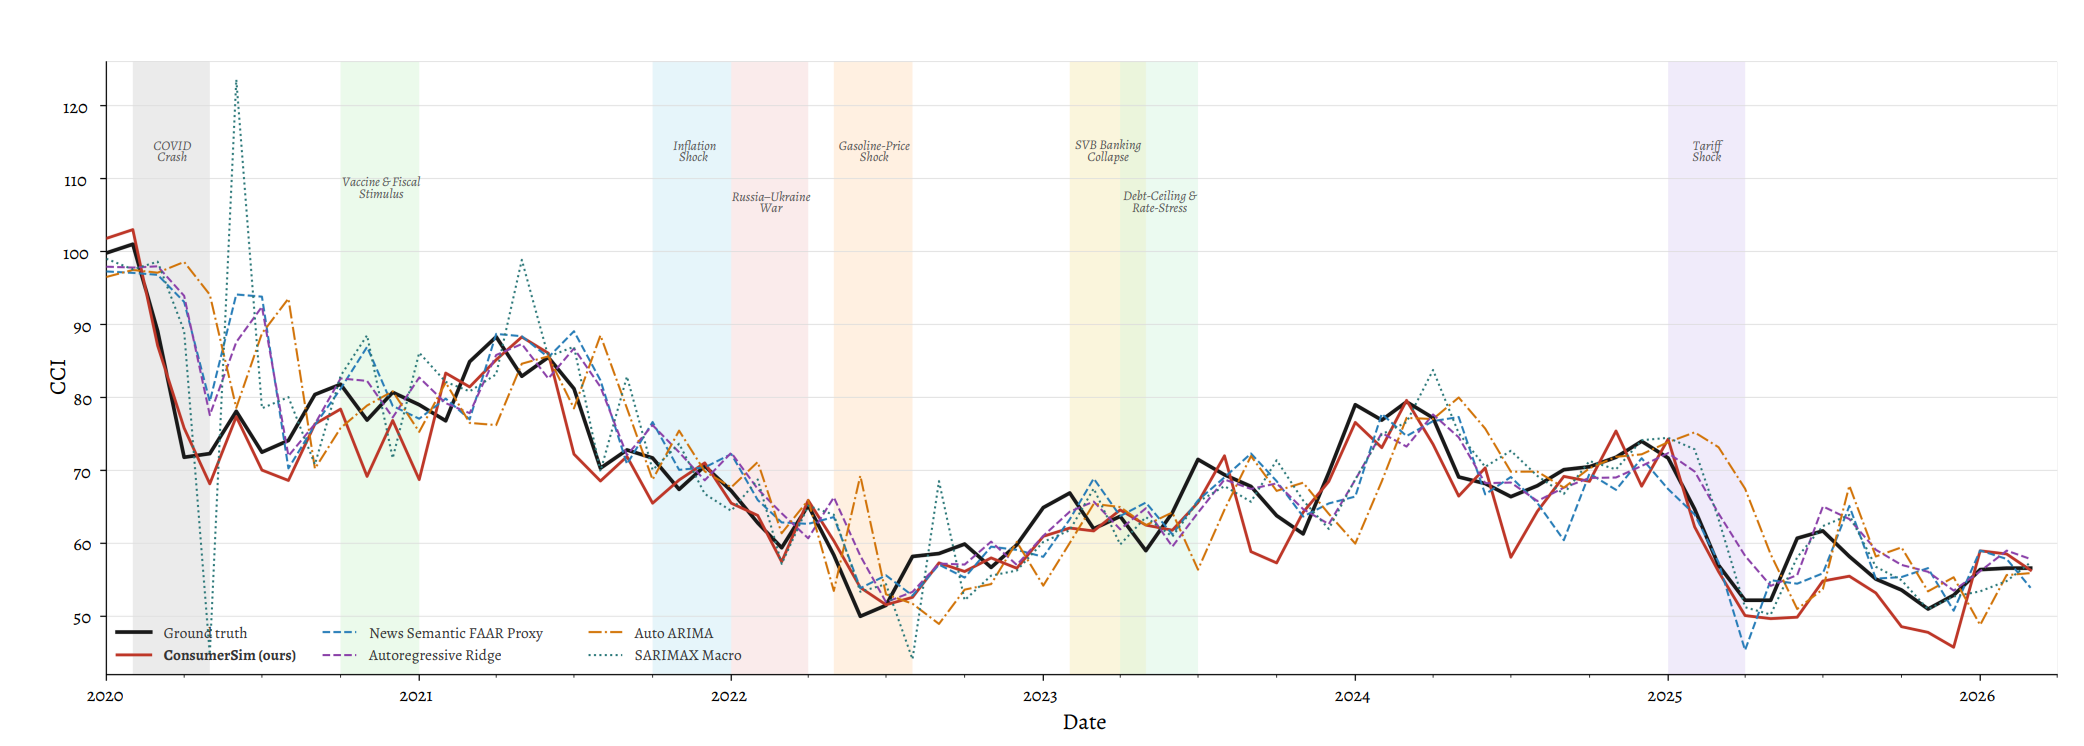
What the wrapped engine can do at full scale is a different picture. This is ConsumerSim's own 2020–2026 historical backtest (from the external pipeline, not this 12-persona study): monthly CCI forecasts against ground truth and classical baselines, through COVID, the inflation shock, and the 2025 tariff shock:
Grounding
Five sourced facts, three declared assumptions, two implementation references.
| entry | basis | role |
|---|---|---|
| Conference Board CCI, Jun 2026 = 91.2 (1985=100) | sourced |
the level the study's own output is explicitly not calibrated to |
| its components: Present Situation 116.4, Expectations 74.4 | sourced |
the empirical "weak now / stronger later" split |
| UMich ICS Jun 2026 = 44.8 (FRED, via the SocioVerse Event service) | sourced |
second index scale, for direction |
| UMich Jul 2026 = 54.4, all five components improved | sourced |
the out-of-sample continuation to test against |
| macro backdrop: CPI +3.9% YoY, UNRATE 4.2%, gasoline $3.831/gal | sourced |
the drivers behind the June news snapshot |
the showcase core_ratio raised above the pipeline default |
assumed |
at the default, a 12-cell pool collapses to a single-person core |
reading the longitudinal axis as as_of accrual |
assumed |
a defensible use of the data actually on hand, not invented future months |
| treating the output as a Conference-Board-style index scale | assumed |
inferred from the pipeline's own correction anchor, not documented upstream |
Implementation references: a Statistics Canada (Survey Methodology, 2002) hierarchical Bayes nonignorable-nonresponse model for multinomial small-area data — the basis for the core → expansion design; and the University of Michigan Surveys of Consumers methodology — the five-question skeleton the decision model answers.
That last assumption is worth reading closely: the scale mapping was inferred
from data files, so it is declared rather than cited. See
Grounding & Provenance
for what sourced / proxy / assumed commit you to.
What you can fork
| param | the question it opens |
|---|---|
region |
does the same information set move a different regional pool the same way? |
target_months |
add 2026-07 once July news exists and test the grounded rebound to 54.4. |
as_of_dates |
denser cutoffs turn the inverted V into a real intraday-style information curve. |
| news / indicator / history inputs | drop the favourable gas-price stories to get a counterfactual — how much of June's forecast was the gasoline narrative? Or feed indicators dated before the cutoff to make indicator_count non-zero. |
core_ratio |
trade LLM budget against expansion variance; at n=12 a single core respondent's flip swings the headline. |
| prediction provider | swap the model behind the survey answers and diff the trajectories. |
The natural first fork is scale: a larger pool with a lower core_ratio
smooths the headline while keeping the LLM budget flat. Reuse is a fork, never
an in-place edit — see Iterate, Versions & Reports.