Chicago Schelling — a transit intervention that made segregation worse
studies/chicago_schelling/ · reference: true · Path C (wrapped legacy
simulator)
Starting from the 2010 census, how does the Black–White dissimilarity index
D_bw evolve over three steps when a CTA rail station opens in a South-Side
tract at step 2, paired with a fair-housing policy broadcast? The hypothesis
was that better transit access draws a more diverse inflow and lowers D_bw.
It did not. This case is the pattern for wrapping a validated legacy
simulator (a Mesa-style Chicago segregation model) behind the four core
interfaces, driving it with real census data, and letting a scheduled
intervention plus audience-scoped broadcasts play out on top — with the
trajectory recording what happened rather than what was hoped for.
P / E / B
| what it is | where it comes from | |
|---|---|---|
| P | 570 persistent households, materialized from 2010 census tracts (chicago.census, scale: small). agent_id encodes race / income bracket / family type / neighborhood type plus the tract GEOID, so every panel row is geo-locatable. Interaction is spatial_adjacency over Queen contiguity; propagation independent. |
population/population.json + population/roster.jsonl |
| E | Four layers on the two axes — see the table below. Provider chicago.env (scale: small, init_mode: census). |
environment/environment.json |
| B | Decision chicago.schelling: each household emits an Action of kind move or stay, carrying ranked_targets. Moves are executed inside the environment's apply, so relocation is an environment mutation, not a bookkeeping trick. |
adapter/decision.py |
The four environment layers:
| layer | modality | scope | dynamics | content |
|---|---|---|---|---|
city_race_share |
physical | macro | endogenous | city-wide racial shares |
tract_local |
physical | local | endogenous | per-tract demographics + 1-hop Queen surroundings |
news |
information | macro | scheduled | citywide policy broadcasts |
ward_notice |
information | local | scheduled | tract-scoped notices |
The intervention is three things firing together at step 2:
- a scheduled event on
tract_local— tract17031612000(New City, South Side),cta_stations += 2; - broadcast
policy_A_citywideonnews,audience: "all", ttl 3 — the station opening plus a citywide fair-housing / anti-displacement program; - broadcast
policy_B_tractonward_notice, audience = that one GEOID, ttl 3 — the same news addressed to the block.
That pairing is the point of the design: the same event reaches everyone as macro information and reaches the affected tract as local information, so you can later fork and vary each channel independently.
One step, and the horizon
One step is one relocation round for the whole city: every household sees
its tract and its Queen neighbours, decides move or stay, and the moves
settle before metrics are computed. n_steps: 3, interaction_rounds: 1,
seed: 42 — four metric rows (t=0 baseline plus three decided steps) over 570
tracked households, 2280 panel rows in study.duckdb.
display_metrics are D_black_white, D_hispanic_white, D_asian_white,
Isolation_black; the store carries more (isolation and exposure indices,
mover diagnostics).
Results
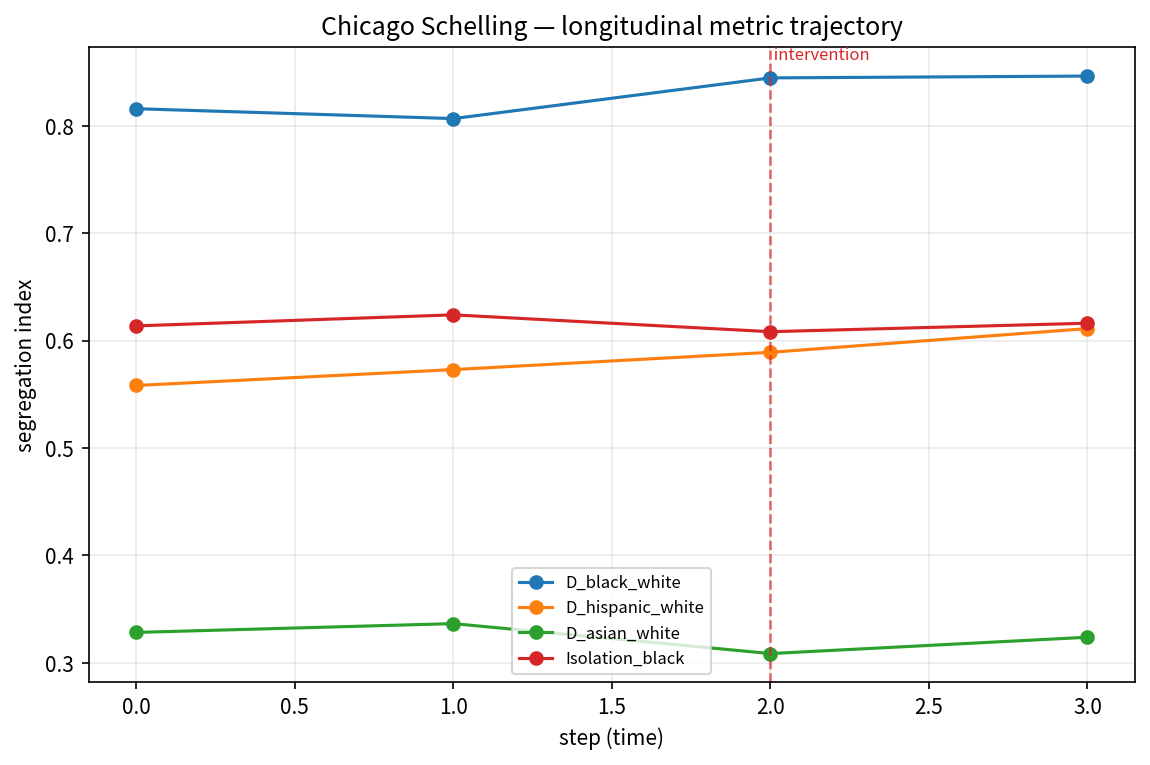
| step | D_bw |
D_hw |
D_aw |
Isolation_black |
n_movers |
pct_pop_moved |
mover_alignment_rate |
|---|---|---|---|---|---|---|---|
| 0 | 0.8160 | 0.5582 | 0.3282 | 0.6137 | — | — | — |
| 1 | 0.8068 | 0.5730 | 0.3364 | 0.6240 | 41 | 0.0349 | 0.220 |
| 2 (intervention) | 0.8447 | 0.5891 | 0.3085 | 0.6083 | 50 | 0.0292 | 0.280 |
| 3 | 0.8464 | 0.6112 | 0.3237 | 0.6162 | 31 | 0.0123 | 0.387 |
The hypothesis was falsified. D_bw rose by +0.0304 over the horizon,
with the jump concentrated exactly at the intervention step. The mechanism is
visible in the panel: in the target tract, the White population went 13 → 0
while the Hispanic population went 0 → 241, with the Black stock nearly
unchanged. The accessibility shock lowered the cost of moving, but the
direction of moving stayed governed by same-group neighbourhood share — so
the nearest majority group, not a returning White population, took the
opportunity, and the tract became more non-White than before.
Two secondary readings survive the same data. mover_alignment_rate climbs
monotonically (0.220 → 0.280 → 0.387): movers get more like-seeking over
time, the classic self-reinforcing tipping signature. And n_movers peaks at
the intervention step and then falls to 31, so the system is re-equilibrating
after a one-off shock, not being permanently stirred.
This is the interesting result, not a failed run
A study whose numbers contradict its own hypothesis field is working as
designed. The artifacts record the falsification, the report explains the
mechanism, and the adjustable_params tell you which knob to turn next
(the report's own next step: rerun on a tract that starts near the tipping
band rather than one already ~100% segregated).
Grounding
grounding/grounding.json carries three sourced facts, three declared
assumptions and two implementation references — and the split is exactly where
you would want it: the magnitudes are sourced, the scenario choices are
declared.
| entry | basis | role |
|---|---|---|
| Chicago metro Black–White dissimilarity = 76 (0–100), 2010 census — Brown University US2010 (Logan/Stults) | sourced |
sanity band for the t=0 D_bw = 0.816 |
| CTA Red Line Extension — 5.5-mile South-Side rail expansion | sourced |
the real shock the step-2 event is modeled on |
| Schelling tolerance threshold 30–50% same-group neighbours | sourced |
bounds the decision model's satisfaction regime |
intervention tract = 17031612000 |
assumed |
a plausible South-Side site; the real RLE terminates further south |
cta_stations += 2 as the station opening |
assumed |
no public metric maps a station onto this accessibility field |
| the paired fair-housing / anti-displacement policy text | assumed |
stylized, not a specific enacted ordinance |
Implementation references: Schelling (1971), Dynamic Models of Segregation — the per-household relocation rule; and a 2025 JAPA quasi-experimental study of transit-induced gentrification — which is precisely why the environment pairs the station with an anti-displacement broadcast, since the literature says the ethnoracial effect can go either way.
resources.json names the two datasets the run actually consumed
(chicago_tracts.geojson, cta_stations.geojson) without recording any
endpoint or key — see
External Capabilities.
What you can fork
adjustable_params — read each as "change this to ask that question":
| param | the question it opens |
|---|---|
n_steps |
does D_bw stabilize at the higher level or slowly relax? Three steps cannot say. |
seed |
how much of the +0.0304 is a single seed's mover draw? |
| intervention tract & step | put the station in a tract inside the tipping band — does accessibility integrate a mixed neighbourhood even though it cannot integrate a segregated one? |
| policy broadcast text | the current text promises anti-displacement but gives no one a reason to move in. Add a citywide targeted-attraction message and A/B it. |
| metrics subset | swap Isolation_black for the exposure indices when the question is contact rather than concentration. |
Forking is the reuse path, not editing: this study is reference: true, so
sv-init routes a matching question to a fork of it. See
Wrap a Legacy Simulator (Path C) for the
seam-and-adapter mechanics, and
Iterate, Versions & Reports for how a
variant is snapshotted.